

2023’s Independence Day Weekend will be the busiest on American roads since pre-pandemic 2019.
As Americans prepare to celebrate Independence Day this coming weekend, a significant increase in domestic travel is anticipated, with a new record projected for the number of people hitting the road. According to AAA, an estimated 50.7 million Americans are predicted to travel 50 miles or more from home during the long weekend. That’s an increase of 2.1 million people compared to 2022, surpassing the previous record of 49 million travelers set in 2019.
AAA expects 43.2 million people, an increase of 2.4% over 2022 and 4% more than 2019, will drive to their destinations this July 4th weekend. To the relief of road trippers, gas prices are currently well below last year’s levels. Last year on July 4th, the national average for a gallon of regular gas was $4.80. This summer, the national average gas price hovers around $3.50 to $3.60 a gallon, thanks to decreased oil costs.
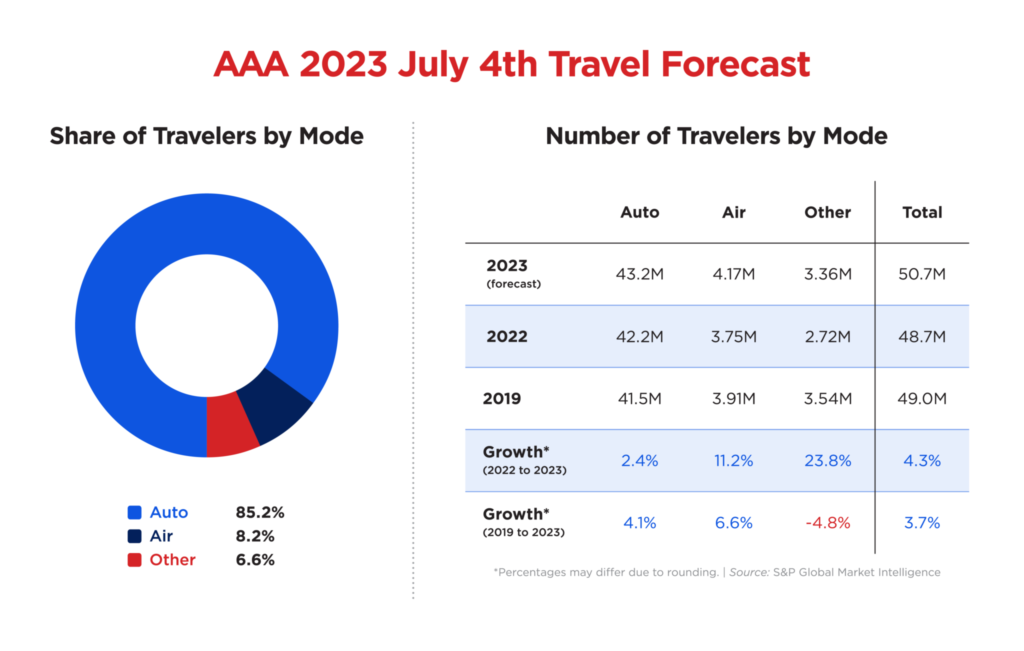
Air travel will see a 8.2% piece of the travel pie for independence day, the highest in 20 years. Other forms of transportation such as buses, cruises, and trains are also seeing a resurgence, with AAA expecting 3.36 million people to choose these methods.
Road trippers should take note of predicted peak congestion times. Data from INRIX, a transportation data provider, suggests that Friday, June 30, may be the busiest day on the roads. The average travel times could increase by nearly 30% over typical conditions. Major metropolitan areas such as Boston, Seattle, and Washington, DC are expected to experience the most severe traffic congestion. To dodge the worst of the gridlock, INRIX recommends leaving either in the morning or after 6 p.m.
Bob Pishue, a transportation analyst at INRIX, advises: “With record-breaking travelers expected on the road this holiday weekend, drivers should prepare for above-average delays to their favorite destinations.” He suggests using traffic apps, local Department of Transportation notifications, and 511 services to minimize holiday travel frustrations.
In the face of all these travel figures, it’s clear that Americans are eager to embrace the spirit of Independence Day this year, with the great American road trip being the preferred method of holiday travel.
| Best and Worst Times to Travel by Car | ||
| Date | Worst Travel Time | Best Travel Time |
| Thu, June 29 | 4:00 – 6:00 PM | Before 12:00 PM |
| Fri, June 30 | 10:00 AM – 5:00 PM | Before 10:00 AM, After 6:00 PM |
| Sat, July 1 | 1:00 PM | Before 12:00 PM |
| Sun, July 2 | Minimal Traffic Impact Expected | |
| Mon, July 3 | Minimal Traffic Impact Expected | |
| Tue, July 4 | 12:00 – 3:00 PM | Before 11:00 AM, After 6:00 PM |
| Wed, July 5 | 3:00 – 6:00 PM | Before 2:00 PM |
| Peak Congestion by Metro | ||||
| Metro | Route | Peak Congestion Period | Est. Travel Time | Compared to Typical |
| Atlanta | Savannah to Atlanta viaI-16 W | Tue, 6PM | 6 hrs 18 mins | 67% |
| Boston | Boston to Hyannis via Pilgrim Hwy S | Fri, 11AM | 2 hrs 24 mins | 63% |
| Chicago | Chicago to Indianapolis via I-65 S | Wed, 5PM | 5 hrs 30 mins | 33% |
| Washington DC | Rehoboth Beach to Washington via US-50 W | Tue, 5PM | 4 hrs | 82% |
| Denver | Fort Collins to Denver viaI-25 S | Fri, 1PM | 2 hrs 24 mins | 60% |
| Detroit | Cleveland to Detroit viaI-90 W | Fri, 10AM | 4 hrs 36 mins | 73% |
| Houston | Houston to Galveston viaI-45 S | Sat, 11AM | 1 hr 18 mins | 52% |
| Los Angeles | Los Angeles to Las Vegas via I-15 N | Sun, 6PM | 6 hrs 12 mins | 60% |
| Minneapolis | Minneapolis to Eau Claire via I-94 E | Wed, 6PM | 2 hrs 36 mins | 30% |
| New York | New York to Jersey Shore via GSP S | Fri, 5PM | 2 hrs 48 mins | 64% |
| Portland | Portland to Cannon Beach via US-26 W | Sat, 1PM | 2 hrs 18 mins | 35% |
| San Diego | Palm Springs to San Diego via I-15 S | Wed, 7AM | 3 hrs 30 mins | 17% |
| San Francisco | San Francisco to Sacramento via I-80 E | Fri, 12PM | 2 hrs 18 mins | 48% |
| Seattle | Seattle to Ellensburg viaI-90 E | Fri, 3PM | 2 hrs 36 mins | 43% |
| Tampa | Tampa to Orlando via I-4 E | Tue, 11AM | 2 hrs 24 mins | 69% |


