More than 47.7 million Americans will take to the nation’s roadways and skies Independence weekend (July 1–5), according to AAA, as travel volumes are expected to nearly fully recover to pre-pandemic levels.
2021 will be the second-highest Independence Day travel on record, trailing 2019 by 1.2 million, and surpassing 2020 by nearly 40% when travel fell to 34.2 million.
With 91% of travel by car, road trips will dominate, despite the continued rise in gas prices. An expected 43.6 million Americans will drive to their destinations, the highest on record for this holiday and 5% more than the previous record set in 2019.
“Travel is in full swing this summer, as Americans eagerly pursue travel opportunities they’ve deferred for the last year-and-a-half,” says Paula Twidale, senior vice president, of AAA Travel. “We saw strong demand for travel around Memorial Day and the kick-off of summer, and all indications now point to a busy Independence Day to follow.”
| 2021 Independence Day Holiday Travelers | ||||
| Total | Automobile | Air | Other(Bus, Train, Cruise) | |
| 2021 (Forecast) | 47.7M | 43.6M | 3.5M | 620,000 |
| 2020 (Actual)* | 34.2M | 32.5M | 1.3M | 359,000 |
| 2019 (Actual) | 48.9M | 41.5M | 3.9M | 3.5M |
| Change (2019 to 2021) | −2.5% | +5.1% | −10.3% | −82.5% |
| Change (2020 to 2021) | +39.6% | +34.1% | +163.8% | +72.7% |
AAA Travel data booking shows theme parks in Orlando and southern California taking destination top spots this 4th of July, with Denver, Las Vegas and Seattle close behind.
Top Independence Day Travel Destinations:
1. Orlando, FL
2. Anaheim, CA
3. Denver, CO
4. Las Vegas, NV
5. Seattle, WA
6. Chicago, IL
7. New York, NY
8. Atlanta, GA
9. Boston, MA
10. Kahului, Maui, HI
Long Delays Expected for Drivers
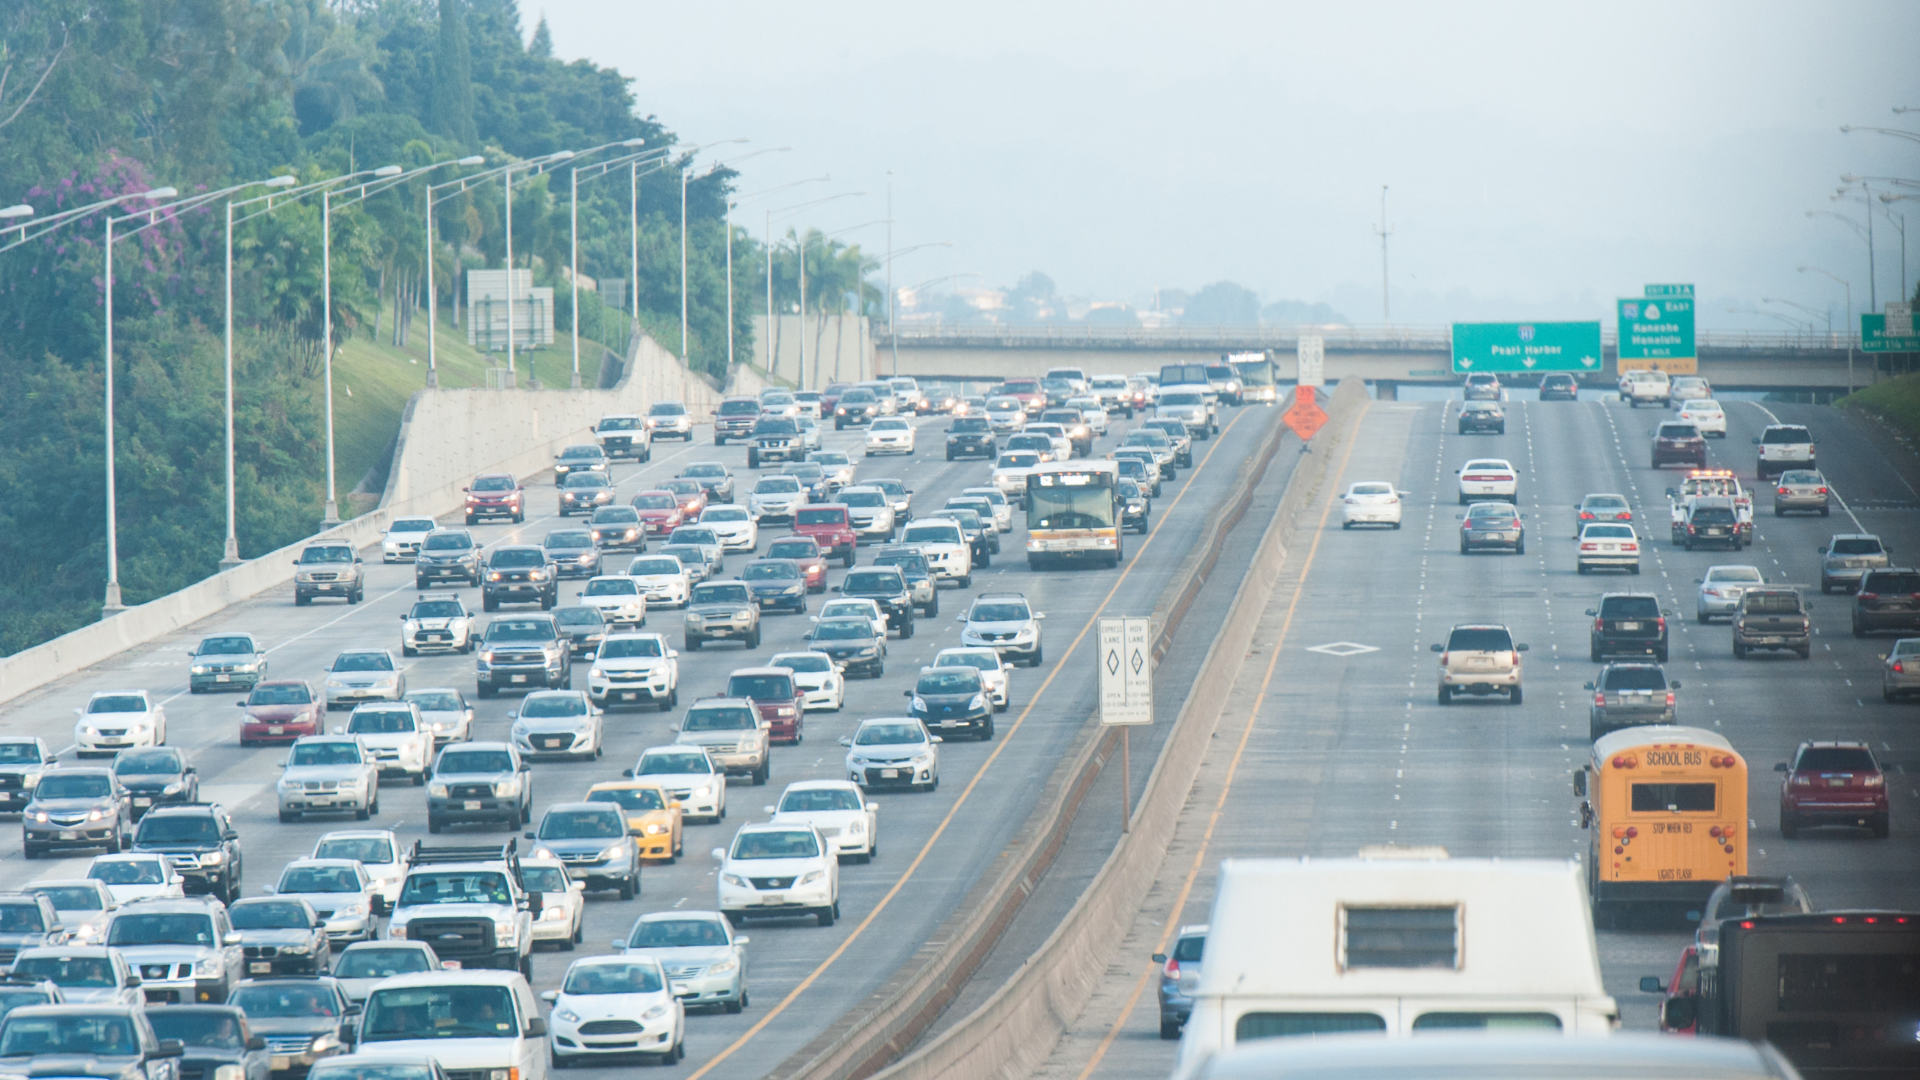
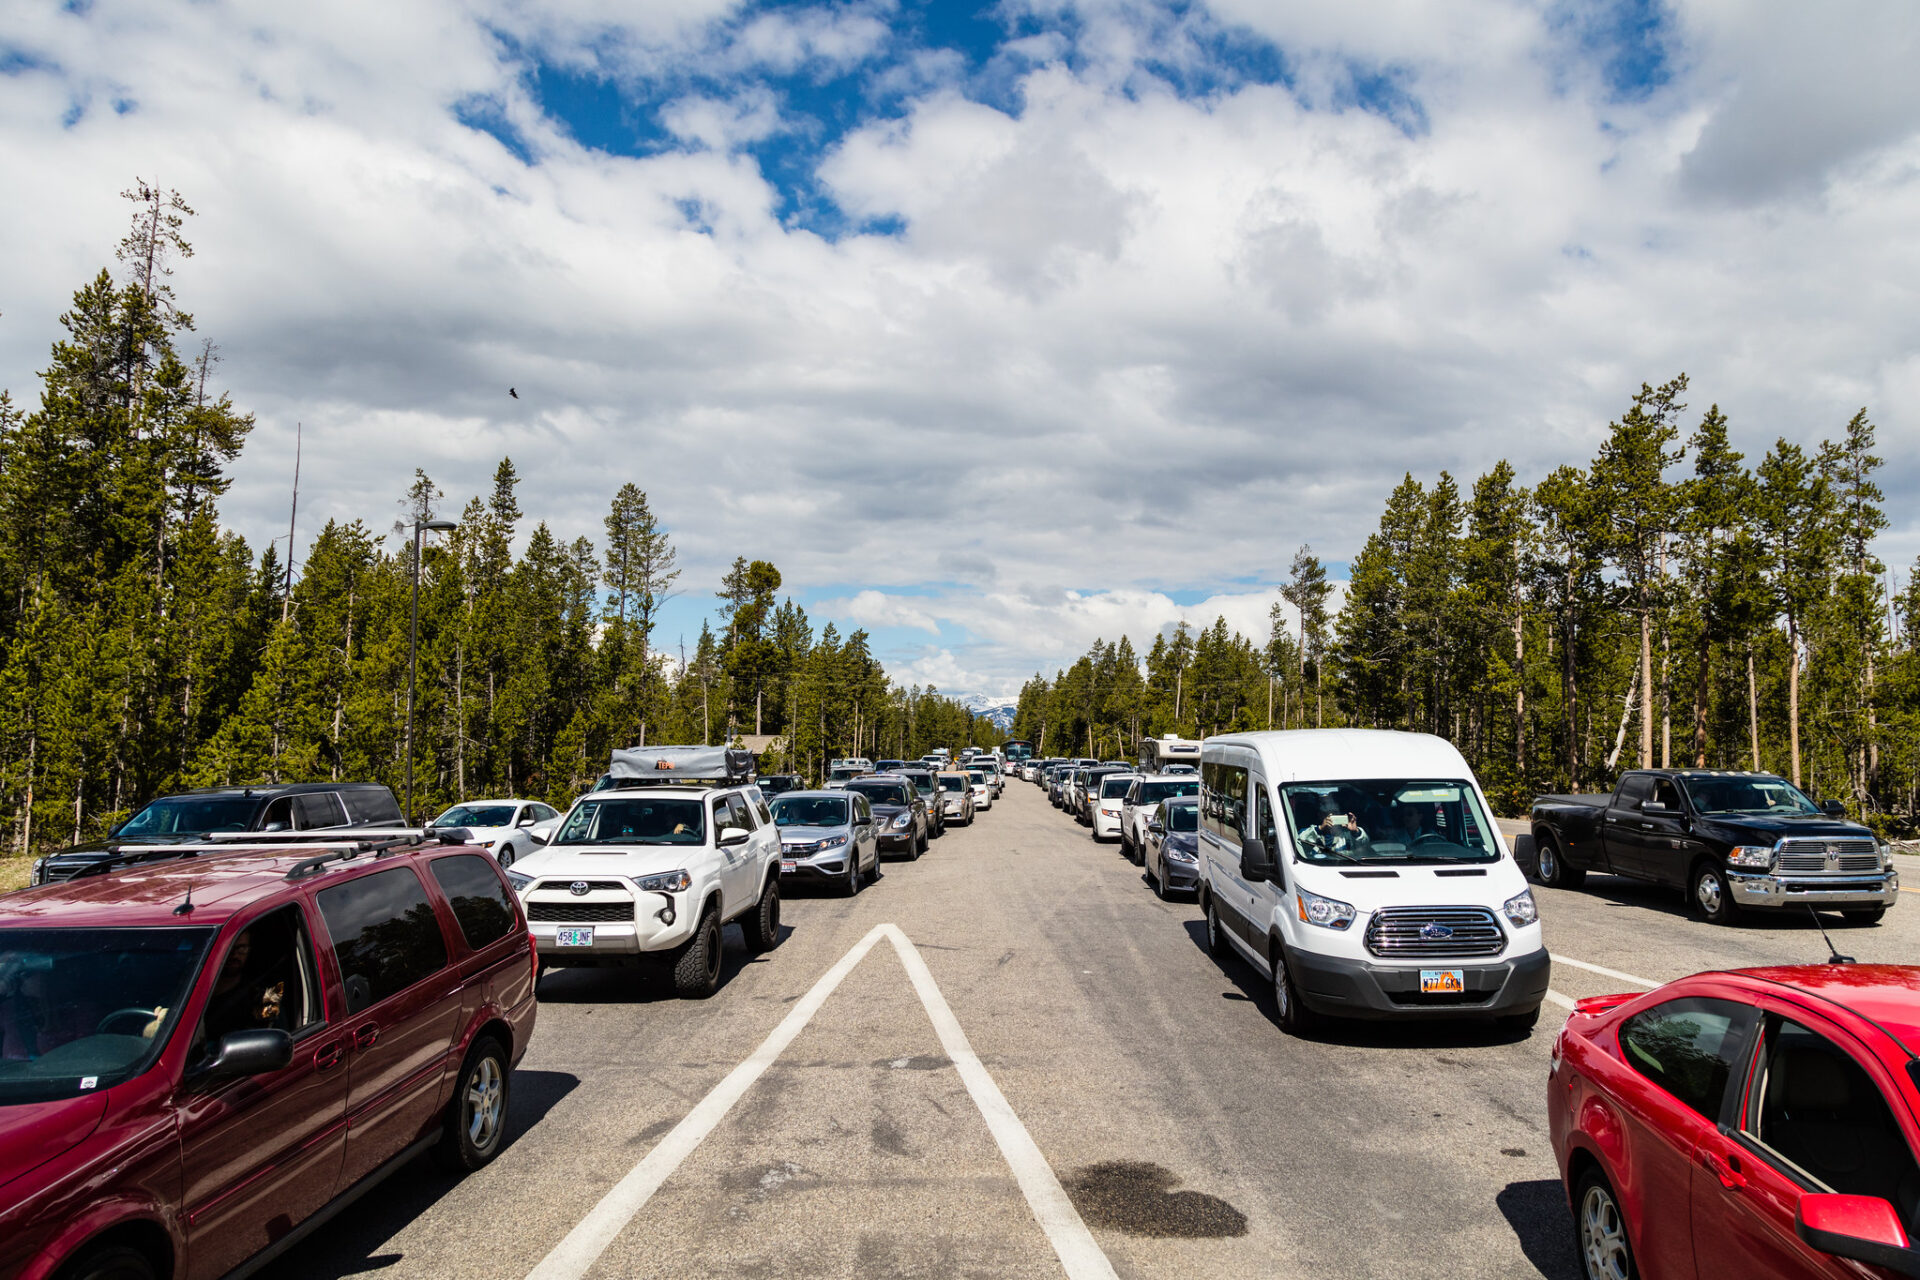
INRIX, in collaboration with AAA, predicts drivers will experience the worst congestion heading into the holiday weekend as commuters leave work early and mix with holiday travelers, along with the return trip on Monday mid-day. Major metro areas across the U.S. could see nearly double the delays with drivers in Boston and San Francisco likely to experience nearly three times the delays.
Worst Corridors and Times to Travel
| Metro Area | Corridor | Peak Congestion | % over Normal |
| Atlanta | I-75 N, Jodeco Road to Jenkinsburg Road | Friday, 1:00–3:00PM | 50% |
| Boston | I-95 S, MA-10 to Sanford Road | Monday, 3:00–5:00PM | 330% |
| Chicago | I-90 E, W Roosevelt Road to I-294 | Friday, 4:00–6:00PM | 50% |
| Detroit | I-75 N, 12 Mile Road to Oakland St | Friday, 3:00–6:00PM | 50% |
| Houston | I-10 W, Bernardo Road to Pin Oak Road | Saturday, 8:00–10:00AM | 50% |
| Los Angeles | I-405 N, I-5 to Jefferson Blvd | Friday, 3:00–5:00PM | 10% |
| New York | I-278 E, Bronx River to Williamsburg St | Thursday, 3:00–5:00PM | 30% |
| San Francisco | CA-17 N, Lark Ave to Mt Hermon Road | Monday, 6:00–8:00PM | 340% |
| Seattle | I-5 S, Capitol Blvd (Olympia) to JBLM | Friday, 1:00–3:00PM | 20% |
| Washington DC | I-95 S, Route 3 to Dumfries Road | Thursday, 2:00–4:00PM | 30% |
| Source: INRIX |
Daily Worst and Best Times to Travel
| Date | Worst Time | Best Time |
| Thursday | 3:00 – 5:00PM | After 7:00PM |
| Friday | 4:00 – 5:00PM | Before 12:00PM |
| Saturday | 11:00AM – 1:00PM | After 2:00PM |
| Sunday | Free flow expected | |
| Monday | 4:00 – 5:00PM | Before 1:00PM |
“With travelers eager to hit the road this summer, we’re expecting nationwide traffic volumes to increase about 15% over normal this holiday weekend,” says Bob Pishue, transportation analyst at INRIX. Our advice is to avoid traveling on Thursday and Friday afternoon, along with Monday mid-day.”
Do you plan to travel this busy holiday weekend? Let us know the comments.


